Which European Countries are the Worst Climate Polluters, and Why?
The 27 member states of the European Union have accounted for about 20% of global cumulative carbon dioxide (CO2) emissions since 1750 (excluding land use, land use change, and forestry). Moreover, amid the global climate crisis, the devastating consequences of human-induced global warming are already seen, predominantly in vulnerable countries of the Global South but also in Europe.
Year after year, the CCPI finds economically developed countries from the Global North, including many EU countries, contributed disproportionally to global warming. Factors such as high greenhouse gas (GHG) emissions, lagging climate policy, and high energy use are responsible for a low rank in the CCPI. We’ll focus on European countries here. Hungary and Poland are the CCPI’s worst-performing European countries. Nevertheless, others are not far off.
EU member states are, therefore, among the countries most responsible for the climate crisis. However, which are the worst polluters, and why? The CCPI can identify them in several easy-to-understand ways. It shows their poor climate performance and opportunities for them to improve on it and take effective climate action.
How to identify which European countries are the worst polluters
Naturally, there are different interpretations and ways to assess polluters. The CCPI is among the most comprehensive. We’ll use our CCPI findings here as we focus on specific European countries contributing to the climate crisis. These countries, through their GHG emissions, are contributing most to climate change and are doing the least to mitigate it.
European countries with the highest GHG emissions
GHGs are what ultimately influences climate and global temperatures, and they make a good starting point for pinpointing the polluters. In 2021 Germany, France, and Italy were the European countries with the highest overall GHG emissions – ranging from ~375,000 to 740,000 ktonnes CO2 eq. However, looking at overall GHG emissions also gives a distorted picture. Countries with larger populations logically have higher resource and energy consumption and, thus, higher GHG emissions. We can account for these population differences and allow a more impartial view of emissions. To do this, we can determine GHG emissions per capita, dividing overall emissions by the country’s population. While some European countries, such as Malta and Luxembourg, have very small populations of below 700,000, others have more than 80 million.
Simply looking at GHG emissions per capita gives a slightly different picture: The highest per capita emissions in the EU in 2021 were from Luxembourg, Ireland, and the Czech Republic. These countries exceeded 10 tonnes CO2 eq per capita in 2021. Therefore, they heavily contributed to the climate crisis. Comparing these countries’ emissions with Paris-compatible pathways (emissions pathways enabling limitation of global warming to well below 2°C) also shows misalignment with the Paris Agreement.
In 2021, Ireland’s GHG emissions were 4.85 tonnes CO2 eq higher than emissions via a Paris-compatible pathway. Ireland’s emissions are far from levels low enough to limit global warming to 1.5°C. However, while current emissions levels in the above countries are alarmingly high, current emissions trends show reductions in all three countries, with a 5-year linear trend of −14% indicating continuing reductions. Nevertheless, emission reductions need to be much faster, as levels remain far too high.
Countries lagging in climate policy
Looking only at GHG emissions per capita already gives a rough overview of national climate performance because emissions are what ultimately influence our global temperatures. However, additionally looking at other indicators provides a more holistic view.
Climate policy is another key aspect for identifying the worst polluters. Ambitious and stringent climate policy is crucial for achieving emission reductions. It can, for starters, help decrease or stop the burning of fossil fuels through increased renewable energy deployment and decreased energy use. Countries with insufficient and lagging national and international climate policies can, and should, be closely watched when targeting polluters.
Hungary
Hungary is the EU country with the worst national and international climate policy as assessed by climate and energy policy experts from NGOs, universities, and think tanks within the countries we evaluated in 2022. Poland and Romania weren’t far behind Hungary.
Hungary received very low grades, on a 1–10 scale, from the CCPI national experts:
- 2.72 for national climate policy
- 2.14 for international climate policy
It was the worst EU performer in both regards. Our national climate and energy policy experts criticised the country’s counter-productive and harmful policies restricting the deployment of renewable energy. These include a ban on the expansion of wind power in 2016, along with increasing fossil fuel subsidies and fossil fuel extraction.
Also, a newly adopted decree (August 2022) allows clearcutting of forests in protected areas (including Natura 2000 areas, EU nature conservation areas) for firewood. This is leading to devastating consequences for biodiversity and threatening carbon sinks, which are important for carbon sequestration in the land sector (see CCPI Hungary country page for specifics).
Poland
Poland is the EU country with the second lowest climate policy evaluation in the CCPI. Poland also regularly tries to block EU climate policy. Both Poland and Hungary have also called for a suspension of the EU Emissions Trading System (EU ETS).
Poland is another laggard in climate policy – among the three EU countries with the worst climate policy at the national and international levels.
You’ll see a similar picture when looking only at international climate policy: Hungary had the worst international climate policy, followed by Romania and Poland.
EU countries with the highest energy use
In seeking out the EU’s worst polluters climate policy alone is insufficient, as it mainly assesses targets and policy frameworks and not their implementation. Further indicators, assessing policy implementation, should be considered. To achieve decarbonisation, climate policy must encourage lower energy demand and increased deployment of renewable energy, as energy savings and expansion of renewables are the backbones of decarbonisation.
Despite the steady decoupling of GHG emissions from GDP (GHG per GDP continuously falling), global GHG emissions are still rising (apart from 2020) as energy use has been rising and the carbon intensity of the energy supply isn’t decreasing. Reducing the energy supply’s carbon intensity through the growth of renewables, and reducing energy demand in developed countries while improving energy efficiency in developing countries, are key steps for reducing emissions.
Per capita energy use is relatively high in most EU countries and considerably higher than in most developing countries. Malta has the lowest yet still used about 56 GJ/capita in 2020. Some EU countries have particularly high use (as of 2020):
- Finland: 229 GJ/capita
- Luxembourg: 226 GJ/capita
- Sweden: 174 GJ/capita
Although per capita energy use is decreasing in all these countries, with 5-year linear trends ranging from −2.92% to −11.58% (a continual decrease), it is still considerably higher than what’s compatible with the Paris Agreement. This underscores the need to drastically reduce energy consumption.
EU countries with the lowest share of renewable energy
The renewable energy share in the total primary energy supply (TPES) is another useful indicator of a country’s energy transition progress/decline. Renewable energy growth is crucial for reducing the energy supply’s carbon intensity and, thus, reducing emissions. In 2020, Malta, Hungary, and the Czech Republic had the lowest share of renewable energy in TPES (in the EU) – ranging from about 6% to about 7.5%. These are particularly low compared with renewable energy shares compatible with the Paris 1.5°C goal.
The graph below shows the need for considerably higher renewable energy shares in order to be Paris-compatible (and reach 100% by 2050).
Measuring climate performance – the CCPI’s methodology
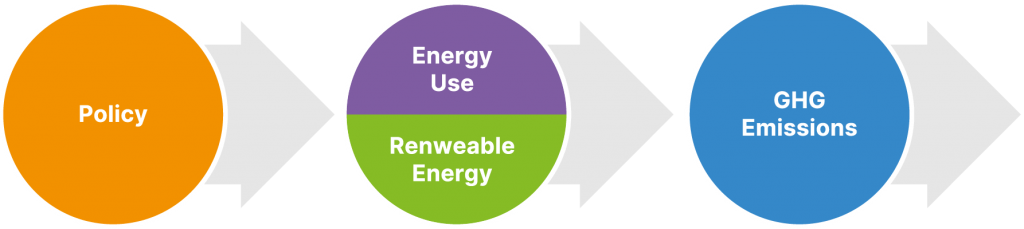
The CCPI assesses the nations’ climate protection efforts by looking at four categories
- GHG Emissions
- Renewable Energy
- Energy Use
- Climate Policy
This lets it provide a more holistic view compared with viewing categories by themselves. More information on how the CCPI measures climate performance can be found here.
The worst-performing EU countries overall in the CCPI
In the CCPI 2023, Hungary and Poland are the worst-performing EU countries. Both have maintained “very low” performance and ranked no better than 40th (averaging 48th) in the last few years.
Hungary (now 53rd) and Poland (now 54th) are the last EU countries still receiving a very low rating. In CCPI 2023, Poland ranked very low in the Climate Policy and GHG Emissions categories and low in Renewable Energy. Hungary performed similarly: low in GHG Emissions, Renewable Energy, and Energy Use, and very low in Climate Policy.
These highly unfavourable results indicate poor performance in all CCPI categories (and an overall poor climate protection performance). They, therefore, emphasise that these countries are heavily driving the climate crisis and doing little to prevent its devastating consequences.
Reasons for very low performance, and why Hungary and Poland rate so low
Hungary and Poland are the lowest-ranked EU countries for the CCPI Climate Policy category (evaluated by our national experts). Both countries receive very low or low ratings in all CCPI 2023 categories, reinforcing their policies’ shortcomings.
Poland has relatively high per capita GHG emissions (very low in this category) of 9.66 tonnes CO2 eq/capita (due to a lack of decisive action to reduce emissions). It also has a 2030 emissions target that’s much higher (2.37 tonnes) than that needed for a Paris-compatible pathway. Hungary has a low share of renewable energy in TPES: 7.02%. This is far from a Paris-aligned share of renewables.
Poland and Hungary have continually ranked low since 2018, and their CCPI performance keeps declining. While other EU countries, such as the Netherlands and Greece, were able to improve their CCPI rankings between 2018 and 2023, Poland and Hungary continued to occupy the lowest ranks.
What can the poor performers do to improve their CCPI rankings?
Drastic climate policy changes are needed to increase the renewable energy share and reduce energy use and, thus, ultimately reduce GHG emissions and improve climate protection performance. Only decisive action will reduce GHG emissions, which are responsible for climate change.
Countries need to:
- enact policies to phase out fossil fuels
- set up support schemes for renewable energy and carbon price signals
- stop expanding fossil fuel infrastructure
- implement regulations and incentives to reduce deforestation and peat cutting and support sustainable agricultural practices
These are among many other policy needs (specific demands voiced by the CCPI country experts can be found on detailed country pages). Through these, poor-performing countries, and even stronger performers that still have ample room to improve, can improve their performance in the climate policy category. And, consequently, improve in the other categories, raising their overall climate protection performance and taking steps towards real climate action.
This article pinpoints the worst of the worst in Europe. Yet no countries we surveyed in the CCPI should become complacent or fall back. Progress towards viable climate action lags across the board. The worst performers have the further to climb. Let’s hope they do so.
Author
Monica Tavares